.png)
With vast amounts of data generated daily, the challenges of analysis and interpretation become increasingly complex. This is particularly true when skewed data with an asymmetrical distribution significantly impacts the accuracy of analytical insights. Skewed data refers to the type of distribution in which the values are not evenly distributed. Effectively visualizing the skewed data is crucial as it helps assess the distribution and guides the selection of appropriate transformations.
This article explains all about skewed data, explores how to interpret skewed data, how to measure skewness, and more.
What is Skewed Data?

Skewed data in data analysis is when the distribution of data points is not symmetrical. In a normal distribution, which appears as a symmetrical, bell-shaped curve on a graph, the dataset's mean, median, and mode are all located at the same point. However, when data is skewed, the data points aren’t evenly spread, and the measures of central tendency don’t align. The distribution curve appears uneven, stretching longer on one side than the other.
What is Skewness?
Skewness is a statistical measure of the degree of asymmetry of a probability distribution around its mean. It indicates whether the data points in a distribution tend to lean towards the left or right side of the mean. Skewness can have positive, zero, negative, or undefined values.
How to Interpret Skewness Values?
Interpreting skewness involves understanding the degree of asymmetry in a probability distribution. Skewness values can vary from negative infinity to positive infinity and provide insights into the distribution’s shape.
Here’s how you can interpret the different types of skewness.
Negative Skewness (Left Skewed)
A negative skewness value signifies that the distribution of data points is more on the right side of the curve. The tail is longer on the left side of the curve and may contain outliers at the lower end of the distribution. In this case, the mean is typically less than the median.
Positive Skewness (Right Skewed)
A positive skewness value signifies that the distribution of data points is more on the left side of the curve. The tail is longer on the right side of the curve and may contain outliers in the upper end of the distribution. In this case, the mean is often more significant than the median.
Zero Skewness (Symmetric)
A zero-skewness value signifies perfect symmetry of the distribution curve around the mean, with the data points evenly distributed, resulting in a balanced shape.
Examples of Skewness
Let’s look into some practical examples of skewed data.
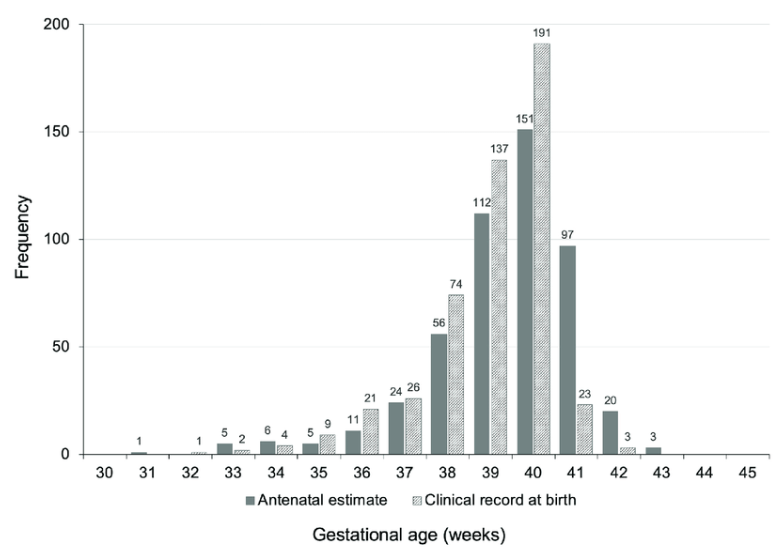
- Left-Skewed Data Distribution: An example of a left-skewed data distribution is the gestational age of births. Most babies are born full-term, but a few are born prematurely. If we plot the data points, the distribution of values for gestational age of births might look like this, with a longer tail on the left side due to premature births.
- Right-Skewed Data Distribution: An example of a right-skewed data distribution is income distribution in the U.S. Most individuals earn around a moderate income, but a few earn higher incomes. If we plot the data points, the distribution of values for individual incomes might look like the representation below. The high-income earners create a long right tail.

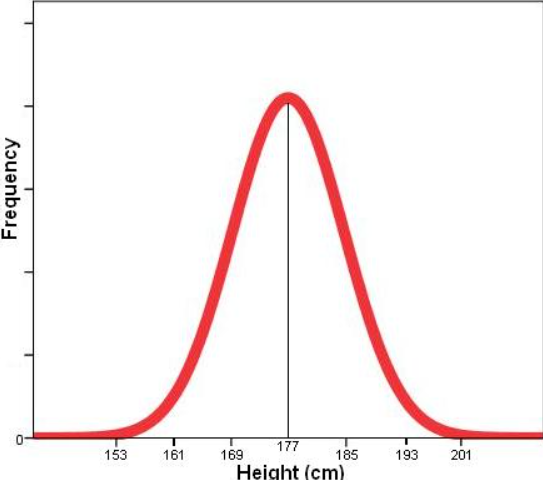
- Zero-Skewed Data Distribution: The height distribution of adults is often symmetrically distributed or zero-skewed since most adults are roughly the same height. For example, the average height of an adult in the U.S. is around 69 inches. If we plot the data points, the distribution of heights might look symmetrical, creating a balanced distribution on both sides of the mean.
Why is Skewness in Data Important?
Skewness holds significance for various reasons, impacting data analysis and decision-making. Here are some use cases of skewness in data:
- Data Preprocessing Guidance: Skewness in datasets helps provide valuable insights into certain preprocessing strategies. For instance, applying logarithmic or square root transformations can normalize skewed data, making it more suitable for specific analytical approaches.
- Detecting Outliers: Skewness aids in detecting outliers within the dataset, often indicated by very long tails or large values of the skewness coefficient. This detection guides the approach to handling the outliers effectively.
- Risk Assessment in Finance: Skewness is crucial for assessing investment risks in financial data analysis. A highly skewed distribution indicates more volatility, impacting risk management strategies and investment decisions.
- Impact on Measures of Central Tendency: Skewness directly influences the central tendency measures, such as the mean, median, and mode. In cases of significant skewness, the mean might be misleading due to the influence of outliers. The median or mode would be a more reliable measure for summarizing the data.
- Informed Decision Making: Recognizing skewness enables stakeholders in business, economics, and other fields to make more informed decisions. With an understanding of data distribution patterns, the outcome is better predictions and strategic planning.
- Impact on Statistical Tests: Many parametric statistical tests, like the t-test, z-test, and Analysis of Variance (ANOVA), assume normal data distribution. Skewness assessment is crucial for determining whether data transformations are necessary or alternative statistical tests should be chosen to ensure accurate and meaningful interpretations.
How Do You Measure Skewness?
The measures of skewness quantify the asymmetry of a probability distribution. There are several ways to calculate the skewness, with the most common being:
1. Karl Pearson’s Coefficient of Skewness
It is a mathematical method used to calculate skewness based on mean and mode using a descriptive statistical formula. This skewness measure is widely used in the banking sector to identify the correlation between a cardholder's credit card and violation rate based on their income.
This skewness measure is also used in statistical analysis to help analysts understand the direction of the skewness in the datasets, helping them make better modeling and analytical decisions.
Here are the two approaches to calculating skewness using Karl Pearson’s Coefficient.
- Pearson’s first skewness coefficient, also known as the Pearson mode skewness. The formula is,

where x is the mean and s is the standard deviation of the sample.
- Pearson's second skewness coefficient, also known as Pearson‘s median skewness. The formula is,
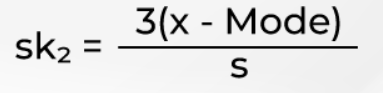
Where x is the mean and s is the standard deviation of the sample.
The coefficient of Karl Pearson’s measure can be interpreted as,
- If Sk=0, the data is symmetric and evenly distributed on the probability distribution curve.
- If Sk>0, the distribution is positively skewed, with more data points on the left side of the mean.
- If Sk<0, it is a negatively skewed distribution, with more data points on the right side of the mean.
2. Kelly’s Measure
It measures skewness by comparing specific percentile values, typically the dataset's 10th, 50th, and 90th percentiles. Kelly’s Measure majorly involves comparing the difference between the median of the 50th percentile and the average of the 10th and 90th percentiles to calculate the skewness of the data.
The formula is given as:
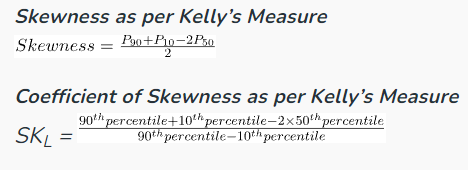
where P90 is the 90th percentile, P10 is the 10th percentile, and P50 is the 50th percentile.
The coefficient of Kelly’s measure can be interpreted as:
- If SKL =0, the data is interpreted to be symmetrically distributed.
- If SKL>0, the data is interpreted to be positively skewed with a longer right tail.
- If SKL <0, the data is interpreted to be negatively skewed with a longer left tail.
3. Bowley’s Measure
This statistical measure, used to calculate the skewness in a probability distribution, is sometimes referred to as quartile skewness. Unlike other skewness measures, which rely on mean and standard deviation, Bowley’s Skewness Coefficient is calculated based on quartiles.
The formula is given as follows:
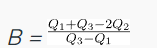
Where Q1 is the first quartile (25th percentile), Q2 is the second quartile (50th percentile), and Q3 is the third quartile (75th percentile).
The coefficient of Bowley’s measure can be interpreted as:
- If B =0, the distribution is symmetric about the mean.
- If B>0, the distribution is positively skewed with a longer right tail.
- If B <0, the distribution is negatively skewed with a longer left tail.
How Can Airbyte Help You Address Skewness in the Data?

Handling skewed data is a crucial step in any data science project. Airbyte, a data integration platform, can be a handy solution. While Airbyte may not be able to handle or modify skewness in data directly, it can efficiently load raw data into systems where you can perform detailed preprocessing and analysis.
Here are some of the key features of Airbyte:
- Pre-built Connectors: Airbyte offers a vast library of 350+ pre-built connectors for seamless connection between a wide range of data sources and destinations. This extensive selection reduces the need for complex coding.
- Connector Development Kit (CDK): In instances where a connector is unavailable, you can quickly construct a custom connector using CDK within minutes. This allows you to create custom connectors, offering flexibility to handle unique data sources.
- Change Data Capture (CDC): Airbyte’s CDC feature optimizes data synchronization by capturing only the changes since the last data transfer rather than transferring the entire dataset each time. This is especially effective for managing large datasets, improving efficiency and reducing bandwidth usage.
To handle the skewed data, you can follow the general approach given below:
- Airbyte allows you to implement custom transformations using dbt (data build tool). With this combination of Airbyte and dbt, you can perform data standardization, cleansing, and mapping.
- Depending on the specific use case and the nature of the data, analyze the data set to identify the variables that exhibit skewness. You can use visualization tools to assess your data's distribution and understand the skewness's nature.
- Transformations like logarithmic, square, or cube root can be applied to mitigate the skewness.
Conclusion
Handling skewed data is an essential aspect of statistical analysis and data processing. Skewed data can significantly distort interpretations of relationships between variables, making visualizations less informative and potentially misleading. Properly addressing skewness improves the reliability of your data and helps extract more valuable insights. By mitigating skewness, you can reduce biases that may otherwise lead to inaccurate conclusions and faulty decision-making.